goat polyclonal anti galectin 3 gal3 Search Results


94
R&D Systems anti goat gal3 antibody
Anti Goat Gal3 Antibody, supplied by R&D Systems, used in various techniques. Bioz Stars score: 94/100, based on 1 PubMed citations. ZERO BIAS - scores, article reviews, protocol conditions and more
https://www.bioz.com/result/anti goat gal3 antibody/product/R&D Systems
Average 94 stars, based on 1 article reviews
anti goat gal3 antibody - by Bioz Stars, 2026-02
94/100 stars
  Buy from Supplier

99
R&D Systems gal3
Up-regulation of <t>Gal3</t> in the plasma and brains of HD patients. a The levels of plasma Gal3 of non-HD ( n = 16), pre-symptomatic HD (Pre-HD, n = 4), and HD individuals ( n = 26) were measured by ELISA. b – f Correlations between the plasma Gal3 levels of HD patients ( n = 26) and their disease burden b , MMSE c , UHDRS-motor d , UHDRS-Independence e , or UHDRS-functional capacity f scores were analyzed by Pearson correlation coefficients. The levels of transcripts of LGALS3 in the g caudate nucleus and h cerebellum of HD patients or non-HD subjects were measured by RT-qPCR ( n = 5 in each group). Each dot represents the plasma Gal3 level or the relative LGALS3 level of a subject. Data in ( a ) were analyzed by one-way ANOVA followed by Holm–Sidak’s multiple comparisons test, * P < 0.05. Data in g and h are presented as the means ± SEM and were analyzed by the unpaired Student’s t -test. * P < 0.05. n.s., not significant. Source data is available as a Source Data File
Gal3, supplied by R&D Systems, used in various techniques. Bioz Stars score: 99/100, based on 1 PubMed citations. ZERO BIAS - scores, article reviews, protocol conditions and more
https://www.bioz.com/result/gal3/product/R&D Systems
Average 99 stars, based on 1 article reviews
gal3 - by Bioz Stars, 2026-02
99/100 stars
  Buy from Supplier

90
R&D Systems biotinylated goat anti galectin 3 gal 3 antibodies
Surface glycosylation of seminal prostasomes: lectin- and immune-transmission electron microscopy. A: Lectin-TEM using SNA. Inserts show enlarged characteristic pattern of SNA-reactivity to each sample group. B: Lectin-TEM using ConA. Inserts show enlarged characteristic pattern of ConA-reactivity to vesicles in each sample group. In O, staining of some proteinaceous material was also observed (arrowheads). C: Immune-TEM using <t>anti-galectin-3</t> antibodies. Inserts show enlarged characteristic pattern of <t>anti-gal-3-reactivity</t> to each sample group. Micrographs show most characteristic patterns obtained. Although differences in the reactivity of particular vesicles could be noticed, it does not affect the general reactivity of the sample (as in IEC when taking all vesicles into account). (N = seminal prostasomes from normozoospermic men; O = seminal prostasomes from oligozoospermic men).
Biotinylated Goat Anti Galectin 3 Gal 3 Antibodies, supplied by R&D Systems, used in various techniques. Bioz Stars score: 90/100, based on 1 PubMed citations. ZERO BIAS - scores, article reviews, protocol conditions and more
https://www.bioz.com/result/biotinylated goat anti galectin 3 gal 3 antibodies/product/R&D Systems
Average 90 stars, based on 1 article reviews
biotinylated goat anti galectin 3 gal 3 antibodies - by Bioz Stars, 2026-02
90/100 stars
  Buy from Supplier

90
R&D Systems goat anti gal 3
Surface glycosylation of seminal prostasomes: lectin- and immune-transmission electron microscopy. A: Lectin-TEM using SNA. Inserts show enlarged characteristic pattern of SNA-reactivity to each sample group. B: Lectin-TEM using ConA. Inserts show enlarged characteristic pattern of ConA-reactivity to vesicles in each sample group. In O, staining of some proteinaceous material was also observed (arrowheads). C: Immune-TEM using <t>anti-galectin-3</t> antibodies. Inserts show enlarged characteristic pattern of <t>anti-gal-3-reactivity</t> to each sample group. Micrographs show most characteristic patterns obtained. Although differences in the reactivity of particular vesicles could be noticed, it does not affect the general reactivity of the sample (as in IEC when taking all vesicles into account). (N = seminal prostasomes from normozoospermic men; O = seminal prostasomes from oligozoospermic men).
Goat Anti Gal 3, supplied by R&D Systems, used in various techniques. Bioz Stars score: 90/100, based on 1 PubMed citations. ZERO BIAS - scores, article reviews, protocol conditions and more
https://www.bioz.com/result/goat anti gal 3/product/R&D Systems
Average 90 stars, based on 1 article reviews
goat anti gal 3 - by Bioz Stars, 2026-02
90/100 stars
  Buy from Supplier

94
R&D Systems biotinylated polyclonal antihuman gal 3 antibody
Surface glycosylation of seminal prostasomes: lectin- and immune-transmission electron microscopy. A: Lectin-TEM using SNA. Inserts show enlarged characteristic pattern of SNA-reactivity to each sample group. B: Lectin-TEM using ConA. Inserts show enlarged characteristic pattern of ConA-reactivity to vesicles in each sample group. In O, staining of some proteinaceous material was also observed (arrowheads). C: Immune-TEM using <t>anti-galectin-3</t> antibodies. Inserts show enlarged characteristic pattern of <t>anti-gal-3-reactivity</t> to each sample group. Micrographs show most characteristic patterns obtained. Although differences in the reactivity of particular vesicles could be noticed, it does not affect the general reactivity of the sample (as in IEC when taking all vesicles into account). (N = seminal prostasomes from normozoospermic men; O = seminal prostasomes from oligozoospermic men).
Biotinylated Polyclonal Antihuman Gal 3 Antibody, supplied by R&D Systems, used in various techniques. Bioz Stars score: 94/100, based on 1 PubMed citations. ZERO BIAS - scores, article reviews, protocol conditions and more
https://www.bioz.com/result/biotinylated polyclonal antihuman gal 3 antibody/product/R&D Systems
Average 94 stars, based on 1 article reviews
biotinylated polyclonal antihuman gal 3 antibody - by Bioz Stars, 2026-02
94/100 stars
  Buy from Supplier

90
R&D Systems goat polyclonal anti galectin gal 3 antibody
Surface glycosylation of seminal prostasomes: lectin- and immune-transmission electron microscopy. A: Lectin-TEM using SNA. Inserts show enlarged characteristic pattern of SNA-reactivity to each sample group. B: Lectin-TEM using ConA. Inserts show enlarged characteristic pattern of ConA-reactivity to vesicles in each sample group. In O, staining of some proteinaceous material was also observed (arrowheads). C: Immune-TEM using <t>anti-galectin-3</t> antibodies. Inserts show enlarged characteristic pattern of <t>anti-gal-3-reactivity</t> to each sample group. Micrographs show most characteristic patterns obtained. Although differences in the reactivity of particular vesicles could be noticed, it does not affect the general reactivity of the sample (as in IEC when taking all vesicles into account). (N = seminal prostasomes from normozoospermic men; O = seminal prostasomes from oligozoospermic men).
Goat Polyclonal Anti Galectin Gal 3 Antibody, supplied by R&D Systems, used in various techniques. Bioz Stars score: 90/100, based on 1 PubMed citations. ZERO BIAS - scores, article reviews, protocol conditions and more
https://www.bioz.com/result/goat polyclonal anti galectin gal 3 antibody/product/R&D Systems
Average 90 stars, based on 1 article reviews
goat polyclonal anti galectin gal 3 antibody - by Bioz Stars, 2026-02
90/100 stars
  Buy from Supplier

94
Proteintech goat serum
Surface glycosylation of seminal prostasomes: lectin- and immune-transmission electron microscopy. A: Lectin-TEM using SNA. Inserts show enlarged characteristic pattern of SNA-reactivity to each sample group. B: Lectin-TEM using ConA. Inserts show enlarged characteristic pattern of ConA-reactivity to vesicles in each sample group. In O, staining of some proteinaceous material was also observed (arrowheads). C: Immune-TEM using <t>anti-galectin-3</t> antibodies. Inserts show enlarged characteristic pattern of <t>anti-gal-3-reactivity</t> to each sample group. Micrographs show most characteristic patterns obtained. Although differences in the reactivity of particular vesicles could be noticed, it does not affect the general reactivity of the sample (as in IEC when taking all vesicles into account). (N = seminal prostasomes from normozoospermic men; O = seminal prostasomes from oligozoospermic men).
Goat Serum, supplied by Proteintech, used in various techniques. Bioz Stars score: 94/100, based on 1 PubMed citations. ZERO BIAS - scores, article reviews, protocol conditions and more
https://www.bioz.com/result/goat serum/product/Proteintech
Average 94 stars, based on 1 article reviews
goat serum - by Bioz Stars, 2026-02
94/100 stars
  Buy from Supplier

90
R&D Systems biotinylated goat anti mouse gal 3 antibody
Surface glycosylation of seminal prostasomes: lectin- and immune-transmission electron microscopy. A: Lectin-TEM using SNA. Inserts show enlarged characteristic pattern of SNA-reactivity to each sample group. B: Lectin-TEM using ConA. Inserts show enlarged characteristic pattern of ConA-reactivity to vesicles in each sample group. In O, staining of some proteinaceous material was also observed (arrowheads). C: Immune-TEM using <t>anti-galectin-3</t> antibodies. Inserts show enlarged characteristic pattern of <t>anti-gal-3-reactivity</t> to each sample group. Micrographs show most characteristic patterns obtained. Although differences in the reactivity of particular vesicles could be noticed, it does not affect the general reactivity of the sample (as in IEC when taking all vesicles into account). (N = seminal prostasomes from normozoospermic men; O = seminal prostasomes from oligozoospermic men).
Biotinylated Goat Anti Mouse Gal 3 Antibody, supplied by R&D Systems, used in various techniques. Bioz Stars score: 90/100, based on 1 PubMed citations. ZERO BIAS - scores, article reviews, protocol conditions and more
https://www.bioz.com/result/biotinylated goat anti mouse gal 3 antibody/product/R&D Systems
Average 90 stars, based on 1 article reviews
biotinylated goat anti mouse gal 3 antibody - by Bioz Stars, 2026-02
90/100 stars
  Buy from Supplier

93
R&D Systems goat anti gal3
( A ) UMAP plot showing integrated clustering of immune cells samples from four mouse models of retinal degeneration, including LD model (sorted by Cx3cr1 + ), NaIO 3 model (CD45 + ), P23H model (CD45 + ) and aging model (CD45 + ) and naïve mice (CD45 + ). A total of 15,623 macrophages, including 13,489 microglia, were integrated among four models. PMN, polymorphonuclear neutrophils; mo-MFs, monocyte-derived macrophages; pv-MFs: perivascular macrophages; NK, natural killer. ( B ) UMAP plots showing integrated macrophage clusters by two datasets. Dash circles indicate subretinal microglia (srMG). ( C ) Percentage of sample distribution by clusters. The arrow indicates the enrichment of srMG cluster from degenerating retinas. ( D ) Heatmap of top 30 conserved marker genes of subretinal microglia shared by each model across clusters. Genes were ranked by fold changes. Arrows indicate srMG cluster. ( E ) In situ validation of <t>Gal3</t> expression on the apical RPE (top) or in the neuroretina from the inner plexiform layer (bottom). Iba1 (green), phalloidin (red, only in RPE) and Gal3 (magenta). Scale bar: 100μm. ( F ) Percentage of Gal3 + cells relative to Iba1 + cells between RPE and neuroretina tissues across models.
Goat Anti Gal3, supplied by R&D Systems, used in various techniques. Bioz Stars score: 93/100, based on 1 PubMed citations. ZERO BIAS - scores, article reviews, protocol conditions and more
https://www.bioz.com/result/goat anti gal3/product/R&D Systems
Average 93 stars, based on 1 article reviews
goat anti gal3 - by Bioz Stars, 2026-02
93/100 stars
  Buy from Supplier

95
Santa Cruz Biotechnology gal 3
( A ) UMAP plot showing integrated clustering of immune cells samples from four mouse models of retinal degeneration, including LD model (sorted by Cx3cr1 + ), NaIO 3 model (CD45 + ), P23H model (CD45 + ) and aging model (CD45 + ) and naïve mice (CD45 + ). A total of 15,623 macrophages, including 13,489 microglia, were integrated among four models. PMN, polymorphonuclear neutrophils; mo-MFs, monocyte-derived macrophages; pv-MFs: perivascular macrophages; NK, natural killer. ( B ) UMAP plots showing integrated macrophage clusters by two datasets. Dash circles indicate subretinal microglia (srMG). ( C ) Percentage of sample distribution by clusters. The arrow indicates the enrichment of srMG cluster from degenerating retinas. ( D ) Heatmap of top 30 conserved marker genes of subretinal microglia shared by each model across clusters. Genes were ranked by fold changes. Arrows indicate srMG cluster. ( E ) In situ validation of <t>Gal3</t> expression on the apical RPE (top) or in the neuroretina from the inner plexiform layer (bottom). Iba1 (green), phalloidin (red, only in RPE) and Gal3 (magenta). Scale bar: 100μm. ( F ) Percentage of Gal3 + cells relative to Iba1 + cells between RPE and neuroretina tissues across models.
Gal 3, supplied by Santa Cruz Biotechnology, used in various techniques. Bioz Stars score: 95/100, based on 1 PubMed citations. ZERO BIAS - scores, article reviews, protocol conditions and more
https://www.bioz.com/result/gal 3/product/Santa Cruz Biotechnology
Average 95 stars, based on 1 article reviews
gal 3 - by Bioz Stars, 2026-02
95/100 stars
  Buy from Supplier

97
Proteintech galectin‑3
( A ) UMAP plot showing integrated clustering of immune cells samples from four mouse models of retinal degeneration, including LD model (sorted by Cx3cr1 + ), NaIO 3 model (CD45 + ), P23H model (CD45 + ) and aging model (CD45 + ) and naïve mice (CD45 + ). A total of 15,623 macrophages, including 13,489 microglia, were integrated among four models. PMN, polymorphonuclear neutrophils; mo-MFs, monocyte-derived macrophages; pv-MFs: perivascular macrophages; NK, natural killer. ( B ) UMAP plots showing integrated macrophage clusters by two datasets. Dash circles indicate subretinal microglia (srMG). ( C ) Percentage of sample distribution by clusters. The arrow indicates the enrichment of srMG cluster from degenerating retinas. ( D ) Heatmap of top 30 conserved marker genes of subretinal microglia shared by each model across clusters. Genes were ranked by fold changes. Arrows indicate srMG cluster. ( E ) In situ validation of <t>Gal3</t> expression on the apical RPE (top) or in the neuroretina from the inner plexiform layer (bottom). Iba1 (green), phalloidin (red, only in RPE) and Gal3 (magenta). Scale bar: 100μm. ( F ) Percentage of Gal3 + cells relative to Iba1 + cells between RPE and neuroretina tissues across models.
Galectin‑3, supplied by Proteintech, used in various techniques. Bioz Stars score: 97/100, based on 1 PubMed citations. ZERO BIAS - scores, article reviews, protocol conditions and more
https://www.bioz.com/result/galectin‑3/product/Proteintech
Average 97 stars, based on 1 article reviews
galectin‑3 - by Bioz Stars, 2026-02
97/100 stars
  Buy from Supplier

Image Search Results


Up-regulation of Gal3 in the plasma and brains of HD patients. a The levels of plasma Gal3 of non-HD ( n = 16), pre-symptomatic HD (Pre-HD, n = 4), and HD individuals ( n = 26) were measured by ELISA. b – f Correlations between the plasma Gal3 levels of HD patients ( n = 26) and their disease burden b , MMSE c , UHDRS-motor d , UHDRS-Independence e , or UHDRS-functional capacity f scores were analyzed by Pearson correlation coefficients. The levels of transcripts of LGALS3 in the g caudate nucleus and h cerebellum of HD patients or non-HD subjects were measured by RT-qPCR ( n = 5 in each group). Each dot represents the plasma Gal3 level or the relative LGALS3 level of a subject. Data in ( a ) were analyzed by one-way ANOVA followed by Holm–Sidak’s multiple comparisons test, * P < 0.05. Data in g and h are presented as the means ± SEM and were analyzed by the unpaired Student’s t -test. * P < 0.05. n.s., not significant. Source data is available as a Source Data File

Journal: Nature Communications

Article Title: Galectin-3 is required for the microglia-mediated brain inflammation in a model of Huntington’s disease

doi: 10.1038/s41467-019-11441-0

Figure Lengend Snippet: Up-regulation of Gal3 in the plasma and brains of HD patients. a The levels of plasma Gal3 of non-HD ( n = 16), pre-symptomatic HD (Pre-HD, n = 4), and HD individuals ( n = 26) were measured by ELISA. b – f Correlations between the plasma Gal3 levels of HD patients ( n = 26) and their disease burden b , MMSE c , UHDRS-motor d , UHDRS-Independence e , or UHDRS-functional capacity f scores were analyzed by Pearson correlation coefficients. The levels of transcripts of LGALS3 in the g caudate nucleus and h cerebellum of HD patients or non-HD subjects were measured by RT-qPCR ( n = 5 in each group). Each dot represents the plasma Gal3 level or the relative LGALS3 level of a subject. Data in ( a ) were analyzed by one-way ANOVA followed by Holm–Sidak’s multiple comparisons test, * P < 0.05. Data in g and h are presented as the means ± SEM and were analyzed by the unpaired Student’s t -test. * P < 0.05. n.s., not significant. Source data is available as a Source Data File

Article Snippet: Primary antibodies included a marker of microglia, IbaI (1:500 for mouse and human brain sections, 1:1000 for cell samples, 019-19741, Wako Laboratory Chemicals), an antibody for brain tissue staining of Gal3 (1:300 for brain sections, AF1197, R&D System), antibodies for the cell staining of Gal3 (0.5 μg/ml, mouse anti-Gal3 B2C10; 1.0 μg/ml goat anti-Gal3 , ), and antibodies for NFκB-p65 (1:100 for tissue sections, 1:200 for cell samples, MAB3026, Millipore), LAMP1 and LAMP2 (1:500, ab24170 and 1:200, ab25339, Abcam), LC3 (1:2000, GTX127375 GeneTex), SDHB (1:500, GTX113833 GeneTex), EM48 (1:500, MAB5374, Millipore), NeuN (1:1000, ABN78 and 1:1000, MAB377, Millipore), S100 (1:1000, Z0311, Dako), CD68 (1:100, ab31630, Abcam), NLRP3 (1:200, AG-20B-0014, AdipoGen), and DARPP32 (1:50, #2302, Cell Signaling).

Techniques: Clinical Proteomics, Enzyme-linked Immunosorbent Assay, Functional Assay, Quantitative RT-PCR

Up-regulation of Gal3 in HD microglia. a An ELISA of Gal3 was performed on plasma collected from 7-week-old, 10.5-week-old, and 12-week-old R6/2 mice and their controls ( n = 7–11 in each group). Each dot represents the value of an individual animal. b qRT-PCR analysis of Lgals3 was performed on cDNA prepared from striatal tissues collected from 5-week-old, 7-week-old, and 12-week-old R6/2 mice and their littermate controls ( n = 6 in each group). c The protein levels of Gal3 in the striatum of R6/2 and their littermate controls (12 weeks old) were analyzed by western blot analysis ( n = 4 in each group). d , e Brain sections from WT and R6/2 mice (12 weeks old, n = 4 in each group) were stained with anti-Gal3 antibody (green) and a microglial marker (IbaI, red). Nuclei were stained with Hoechst (blue). Arrows mark the IbaI-positive cells (i.e., microglia). f , g Primary cultures of microglia prepared from R6/2 and littermates as described in the “Methods” section. The cells were collected 2 days after plating and were stained with anti-Gal3 antibody (red) and anti-IbaI antibody (gray). Three independent experiments were performed. h Representative histogram plot of WT and R6/2 microglia stained with Gal3 and assessed by flow cytometry. i The levels of Lgal3 transcripts in primary microglia were quantified by RT-qPCR. Three independent experiments were performed. j Brain sections from WT and Hdh 150Q mice (21 months; n = 3 in each group) were stained with anti-Gal3 (green) and anti-IbaI antibodies (red). Nuclei were stained with Hoechst (blue). Arrows mark the IbaI-positive cells (i.e., microglia). k Striatal tissues of Hdh 150Q (15 months old; n = 3 in each group) were carefully removed for RNA preparation and were subjected to RT-qPCR as detailed in the “Methods” section. Data in a and b were analyzed by two-way ANOVA followed by Sidak’s multiple comparisons test. * P < 0.05. Data in c – k are presented as the means ± SEM and were analyzed by the unpaired Student’s t -test. * P < 0.05, *** P < 0.001, **** P < 0.0001. n.s., not significant. Scale bar: 10 µm. Source data is available as a Source Data File

Journal: Nature Communications

Article Title: Galectin-3 is required for the microglia-mediated brain inflammation in a model of Huntington’s disease

doi: 10.1038/s41467-019-11441-0

Figure Lengend Snippet: Up-regulation of Gal3 in HD microglia. a An ELISA of Gal3 was performed on plasma collected from 7-week-old, 10.5-week-old, and 12-week-old R6/2 mice and their controls ( n = 7–11 in each group). Each dot represents the value of an individual animal. b qRT-PCR analysis of Lgals3 was performed on cDNA prepared from striatal tissues collected from 5-week-old, 7-week-old, and 12-week-old R6/2 mice and their littermate controls ( n = 6 in each group). c The protein levels of Gal3 in the striatum of R6/2 and their littermate controls (12 weeks old) were analyzed by western blot analysis ( n = 4 in each group). d , e Brain sections from WT and R6/2 mice (12 weeks old, n = 4 in each group) were stained with anti-Gal3 antibody (green) and a microglial marker (IbaI, red). Nuclei were stained with Hoechst (blue). Arrows mark the IbaI-positive cells (i.e., microglia). f , g Primary cultures of microglia prepared from R6/2 and littermates as described in the “Methods” section. The cells were collected 2 days after plating and were stained with anti-Gal3 antibody (red) and anti-IbaI antibody (gray). Three independent experiments were performed. h Representative histogram plot of WT and R6/2 microglia stained with Gal3 and assessed by flow cytometry. i The levels of Lgal3 transcripts in primary microglia were quantified by RT-qPCR. Three independent experiments were performed. j Brain sections from WT and Hdh 150Q mice (21 months; n = 3 in each group) were stained with anti-Gal3 (green) and anti-IbaI antibodies (red). Nuclei were stained with Hoechst (blue). Arrows mark the IbaI-positive cells (i.e., microglia). k Striatal tissues of Hdh 150Q (15 months old; n = 3 in each group) were carefully removed for RNA preparation and were subjected to RT-qPCR as detailed in the “Methods” section. Data in a and b were analyzed by two-way ANOVA followed by Sidak’s multiple comparisons test. * P < 0.05. Data in c – k are presented as the means ± SEM and were analyzed by the unpaired Student’s t -test. * P < 0.05, *** P < 0.001, **** P < 0.0001. n.s., not significant. Scale bar: 10 µm. Source data is available as a Source Data File

Article Snippet: Primary antibodies included a marker of microglia, IbaI (1:500 for mouse and human brain sections, 1:1000 for cell samples, 019-19741, Wako Laboratory Chemicals), an antibody for brain tissue staining of Gal3 (1:300 for brain sections, AF1197, R&D System), antibodies for the cell staining of Gal3 (0.5 μg/ml, mouse anti-Gal3 B2C10; 1.0 μg/ml goat anti-Gal3 , ), and antibodies for NFκB-p65 (1:100 for tissue sections, 1:200 for cell samples, MAB3026, Millipore), LAMP1 and LAMP2 (1:500, ab24170 and 1:200, ab25339, Abcam), LC3 (1:2000, GTX127375 GeneTex), SDHB (1:500, GTX113833 GeneTex), EM48 (1:500, MAB5374, Millipore), NeuN (1:1000, ABN78 and 1:1000, MAB377, Millipore), S100 (1:1000, Z0311, Dako), CD68 (1:100, ab31630, Abcam), NLRP3 (1:200, AG-20B-0014, AdipoGen), and DARPP32 (1:50, #2302, Cell Signaling).

Techniques: Enzyme-linked Immunosorbent Assay, Clinical Proteomics, Quantitative RT-PCR, Western Blot, Staining, Marker, Flow Cytometry

Inhibition of the NFκB pathway reduces the abnormal up-regulation of Gal3. a , b Primary microglia harvested from R6/2 mice and their littermate controls (WT) were cultured for 24 h and then treated with Bay11-702 (3 µM) or vehicle (0.1% DMSO) as indicated for 24 h and were then fixed for immunofluorescence staining of Gal3 (green), IbaI (gray), and p65 (red). Nuclei were stained with Hoechst (blue). The localization of nuclei in the right-most panels is outlined by dotted lines. The color bars labeled p65 intensity represent the level of p65 intensity, from low to high fluorescence signals (blue → red, respectively). c An NFκB transcription factor assay was performed on the nuclear extracts prepared from the indicated primary microglia ( n = 4). d ELISA was performed on the supernatants collected from the indicated primary microglia to measure the levels of IL1β, IL6, TNFα, and IL10 released by the cells. One dot represents the mean value of each sample. e The levels of nitrite (NO) in the supernatants were measured using the Griess reagent ( n = 5). The results were analyzed by two-way ANOVA followed by Tukey’s post hoc test. Data are presented as the means ± SEM. *Specific comparison between WT and R6/2 cells of the same treatment; #Specific comparison between the Bay11-treated and DMSO-treated groups of the same genotype; * P < 0.05, ** P < 0.01, *** P < 0.001, **** P < 0.0001. Same P -value denotation for #. Scale bar: 10 µm. Source data is available as a Source Data File

Journal: Nature Communications

Article Title: Galectin-3 is required for the microglia-mediated brain inflammation in a model of Huntington’s disease

doi: 10.1038/s41467-019-11441-0

Figure Lengend Snippet: Inhibition of the NFκB pathway reduces the abnormal up-regulation of Gal3. a , b Primary microglia harvested from R6/2 mice and their littermate controls (WT) were cultured for 24 h and then treated with Bay11-702 (3 µM) or vehicle (0.1% DMSO) as indicated for 24 h and were then fixed for immunofluorescence staining of Gal3 (green), IbaI (gray), and p65 (red). Nuclei were stained with Hoechst (blue). The localization of nuclei in the right-most panels is outlined by dotted lines. The color bars labeled p65 intensity represent the level of p65 intensity, from low to high fluorescence signals (blue → red, respectively). c An NFκB transcription factor assay was performed on the nuclear extracts prepared from the indicated primary microglia ( n = 4). d ELISA was performed on the supernatants collected from the indicated primary microglia to measure the levels of IL1β, IL6, TNFα, and IL10 released by the cells. One dot represents the mean value of each sample. e The levels of nitrite (NO) in the supernatants were measured using the Griess reagent ( n = 5). The results were analyzed by two-way ANOVA followed by Tukey’s post hoc test. Data are presented as the means ± SEM. *Specific comparison between WT and R6/2 cells of the same treatment; #Specific comparison between the Bay11-treated and DMSO-treated groups of the same genotype; * P < 0.05, ** P < 0.01, *** P < 0.001, **** P < 0.0001. Same P -value denotation for #. Scale bar: 10 µm. Source data is available as a Source Data File

Article Snippet: Primary antibodies included a marker of microglia, IbaI (1:500 for mouse and human brain sections, 1:1000 for cell samples, 019-19741, Wako Laboratory Chemicals), an antibody for brain tissue staining of Gal3 (1:300 for brain sections, AF1197, R&D System), antibodies for the cell staining of Gal3 (0.5 μg/ml, mouse anti-Gal3 B2C10; 1.0 μg/ml goat anti-Gal3 , ), and antibodies for NFκB-p65 (1:100 for tissue sections, 1:200 for cell samples, MAB3026, Millipore), LAMP1 and LAMP2 (1:500, ab24170 and 1:200, ab25339, Abcam), LC3 (1:2000, GTX127375 GeneTex), SDHB (1:500, GTX113833 GeneTex), EM48 (1:500, MAB5374, Millipore), NeuN (1:1000, ABN78 and 1:1000, MAB377, Millipore), S100 (1:1000, Z0311, Dako), CD68 (1:100, ab31630, Abcam), NLRP3 (1:200, AG-20B-0014, AdipoGen), and DARPP32 (1:50, #2302, Cell Signaling).

Techniques: Inhibition, Cell Culture, Immunofluorescence, Staining, Labeling, Fluorescence, Transcription Factor Assay, Enzyme-linked Immunosorbent Assay, Comparison

Suppression of Gal3 reduces the activation of NFκB and inflammation. a , b Primary microglia were infected with the indicated lentiviruses expressing shRNA against Gal3 (i.e., sh Lgals3 ) to knockdown Gal3 or the control lentivirus (sh GFP ), as described in the “Methods” section. One week after infection, the levels of Gal3 (green) and nuclear p65 (red) were analyzed by immunofluorescence staining. Nuclei were stained with Hoechst. The localization of nuclei in the right-most panels is outlined by dotted lines. The color bars labeled p65 intensity represent the level of p65 intensity, from low to high fluorescence signals (blue → red, respectively). c An NFκB transcription factor assay was performed on the nuclear extracts prepared from the indicated primary microglia ( n = 4). d , e ELISA and NO assays were performed on the supernatants collected from the indicated primary microglia to measure the levels of IL1β, IL6, TNFα, IL10, and nitrite released by the cells. One dot represents the mean value of each sample. The results were analyzed by two-way ANOVA, followed by Tukey’s post hoc test. Data are presented as the means ± SEM. *Specific comparison between WT and R6/2 cells infected with the same lentivirus; #Specific comparison between the sh GFP -infected and sh Lgals3 -infected groups of the same genotype; * P < 0.05, ** P < 0.01, *** P < 0.001, **** P < 0.0001. Same P -value denotation for #. Scale bar: 10 µm. Source data is available as a Source Data File

Journal: Nature Communications

Article Title: Galectin-3 is required for the microglia-mediated brain inflammation in a model of Huntington’s disease

doi: 10.1038/s41467-019-11441-0

Figure Lengend Snippet: Suppression of Gal3 reduces the activation of NFκB and inflammation. a , b Primary microglia were infected with the indicated lentiviruses expressing shRNA against Gal3 (i.e., sh Lgals3 ) to knockdown Gal3 or the control lentivirus (sh GFP ), as described in the “Methods” section. One week after infection, the levels of Gal3 (green) and nuclear p65 (red) were analyzed by immunofluorescence staining. Nuclei were stained with Hoechst. The localization of nuclei in the right-most panels is outlined by dotted lines. The color bars labeled p65 intensity represent the level of p65 intensity, from low to high fluorescence signals (blue → red, respectively). c An NFκB transcription factor assay was performed on the nuclear extracts prepared from the indicated primary microglia ( n = 4). d , e ELISA and NO assays were performed on the supernatants collected from the indicated primary microglia to measure the levels of IL1β, IL6, TNFα, IL10, and nitrite released by the cells. One dot represents the mean value of each sample. The results were analyzed by two-way ANOVA, followed by Tukey’s post hoc test. Data are presented as the means ± SEM. *Specific comparison between WT and R6/2 cells infected with the same lentivirus; #Specific comparison between the sh GFP -infected and sh Lgals3 -infected groups of the same genotype; * P < 0.05, ** P < 0.01, *** P < 0.001, **** P < 0.0001. Same P -value denotation for #. Scale bar: 10 µm. Source data is available as a Source Data File

Article Snippet: Primary antibodies included a marker of microglia, IbaI (1:500 for mouse and human brain sections, 1:1000 for cell samples, 019-19741, Wako Laboratory Chemicals), an antibody for brain tissue staining of Gal3 (1:300 for brain sections, AF1197, R&D System), antibodies for the cell staining of Gal3 (0.5 μg/ml, mouse anti-Gal3 B2C10; 1.0 μg/ml goat anti-Gal3 , ), and antibodies for NFκB-p65 (1:100 for tissue sections, 1:200 for cell samples, MAB3026, Millipore), LAMP1 and LAMP2 (1:500, ab24170 and 1:200, ab25339, Abcam), LC3 (1:2000, GTX127375 GeneTex), SDHB (1:500, GTX113833 GeneTex), EM48 (1:500, MAB5374, Millipore), NeuN (1:1000, ABN78 and 1:1000, MAB377, Millipore), S100 (1:1000, Z0311, Dako), CD68 (1:100, ab31630, Abcam), NLRP3 (1:200, AG-20B-0014, AdipoGen), and DARPP32 (1:50, #2302, Cell Signaling).

Techniques: Activation Assay, Infection, Expressing, shRNA, Knockdown, Control, Immunofluorescence, Staining, Labeling, Fluorescence, Transcription Factor Assay, Enzyme-linked Immunosorbent Assay, Comparison

Inhibition of Gal3 by TD139 intracellularly suppresses microglial inflammation. a Primary microglia were cultured for 24 h and then treated with a cell-permeable Gal3 inhibitor, TD139 (1 and 10 µM), or vehicle (0.1% DMSO) for 48 h, and the supernatants were then collected for measurement of IL1β, IL6, TNFα, and IL10 levels using ELISA ( n = 6). b Primary microglia were treated with lactose (10 and 100 mM) to block the binding of extracellular Gal3. Sucrose served as the osmolarity control. The supernatant was collected and subjected to ELISA ( n = 6–7). Suc sucrose, Lac lactose. The results of a were analyzed by two-way ANOVA followed by Tukey’s post hoc test. *Specific comparison between WT and R6/2 cells of the same treatment; #Specific comparison between the DMSO-treated and TD139-treated groups of the same genotype; P < 0.01. Results in b were analyzed by one-way ANOVA followed by Tukey’s post hoc test. *Specific comparison between WT and R6/2 cells; #Specific comparison between R6/2 cells treated with Lac and Suc. Data are presented as the means ± SEM from the indicated sets of cells. ** P < 0.01, *** P < 0.001, **** P < 0.0001. Same P -value denotation for #. Source data is available as a Source Data File

Journal: Nature Communications

Article Title: Galectin-3 is required for the microglia-mediated brain inflammation in a model of Huntington’s disease

doi: 10.1038/s41467-019-11441-0

Figure Lengend Snippet: Inhibition of Gal3 by TD139 intracellularly suppresses microglial inflammation. a Primary microglia were cultured for 24 h and then treated with a cell-permeable Gal3 inhibitor, TD139 (1 and 10 µM), or vehicle (0.1% DMSO) for 48 h, and the supernatants were then collected for measurement of IL1β, IL6, TNFα, and IL10 levels using ELISA ( n = 6). b Primary microglia were treated with lactose (10 and 100 mM) to block the binding of extracellular Gal3. Sucrose served as the osmolarity control. The supernatant was collected and subjected to ELISA ( n = 6–7). Suc sucrose, Lac lactose. The results of a were analyzed by two-way ANOVA followed by Tukey’s post hoc test. *Specific comparison between WT and R6/2 cells of the same treatment; #Specific comparison between the DMSO-treated and TD139-treated groups of the same genotype; P < 0.01. Results in b were analyzed by one-way ANOVA followed by Tukey’s post hoc test. *Specific comparison between WT and R6/2 cells; #Specific comparison between R6/2 cells treated with Lac and Suc. Data are presented as the means ± SEM from the indicated sets of cells. ** P < 0.01, *** P < 0.001, **** P < 0.0001. Same P -value denotation for #. Source data is available as a Source Data File

Article Snippet: Primary antibodies included a marker of microglia, IbaI (1:500 for mouse and human brain sections, 1:1000 for cell samples, 019-19741, Wako Laboratory Chemicals), an antibody for brain tissue staining of Gal3 (1:300 for brain sections, AF1197, R&D System), antibodies for the cell staining of Gal3 (0.5 μg/ml, mouse anti-Gal3 B2C10; 1.0 μg/ml goat anti-Gal3 , ), and antibodies for NFκB-p65 (1:100 for tissue sections, 1:200 for cell samples, MAB3026, Millipore), LAMP1 and LAMP2 (1:500, ab24170 and 1:200, ab25339, Abcam), LC3 (1:2000, GTX127375 GeneTex), SDHB (1:500, GTX113833 GeneTex), EM48 (1:500, MAB5374, Millipore), NeuN (1:1000, ABN78 and 1:1000, MAB377, Millipore), S100 (1:1000, Z0311, Dako), CD68 (1:100, ab31630, Abcam), NLRP3 (1:200, AG-20B-0014, AdipoGen), and DARPP32 (1:50, #2302, Cell Signaling).

Techniques: Inhibition, Cell Culture, Enzyme-linked Immunosorbent Assay, Blocking Assay, Binding Assay, Control, Comparison

Knockdown of Gal3 improves the clearance of damaged lysosomes. a Primary cultures of microglia were prepared as described in the “Methods” section. The cells were harvested 2 days after plating and stained with a lysosomal marker (LAMP1, green) and anti-Gal3 antibody (red). b The percentages of microglial cells exhibiting Gal3 puncta (6–10 pixels in width) were quantified from more than 100 cells in each group. Galectin-3 puncta is the marker of vesicle rupture. b , c The signals of LAMP1 and the percentage of colocalization with Gal3 puncta were quantified. Data are presented as the means ± SEM and were analyzed by the unpaired Student’s t -test. d Primary microglia were infected with the indicated lentiviruses expressing shRNA against Gal3 (i.e., sh Lgals3 ) to knockdown Gal3 or the control lentivirus (sh GFP ), as described in the “Methods” section. One week after infection, the levels of Gal3 (red) and LAMP1 (green) were analyzed by immunofluorescence staining. Nuclei were stained with Hoechst. e , f Primary microglia were treated with TD139 (10 µM) or vehicle (0.1% DMSO) for 48 h. After 48 h, cells of the indicated treatment were incubated with the Magic Red solution for 30 min and visualized by confocal microscopy e or monitored by a fluorescence microplate reader as described in the “Methods” section f . The results were analyzed by two-way ANOVA, followed by Tukey’s post hoc test. Data are presented as the means ± SEM. *Specific comparison between WT and R6/2 cells infected with the same lentivirus or treatment; #Specific comparison between the sh GFP -infected and sh Lgals3 -infected groups or DMSO-treated and TD139-treated groups of the same genotype; * P < 0.05, ** P < 0.01, *** P < 0.001, **** P < 0.0001. Same P -value denotation for #. Scale bar: 10 µm. Source data is available as a Source Data File

Journal: Nature Communications

Article Title: Galectin-3 is required for the microglia-mediated brain inflammation in a model of Huntington’s disease

doi: 10.1038/s41467-019-11441-0

Figure Lengend Snippet: Knockdown of Gal3 improves the clearance of damaged lysosomes. a Primary cultures of microglia were prepared as described in the “Methods” section. The cells were harvested 2 days after plating and stained with a lysosomal marker (LAMP1, green) and anti-Gal3 antibody (red). b The percentages of microglial cells exhibiting Gal3 puncta (6–10 pixels in width) were quantified from more than 100 cells in each group. Galectin-3 puncta is the marker of vesicle rupture. b , c The signals of LAMP1 and the percentage of colocalization with Gal3 puncta were quantified. Data are presented as the means ± SEM and were analyzed by the unpaired Student’s t -test. d Primary microglia were infected with the indicated lentiviruses expressing shRNA against Gal3 (i.e., sh Lgals3 ) to knockdown Gal3 or the control lentivirus (sh GFP ), as described in the “Methods” section. One week after infection, the levels of Gal3 (red) and LAMP1 (green) were analyzed by immunofluorescence staining. Nuclei were stained with Hoechst. e , f Primary microglia were treated with TD139 (10 µM) or vehicle (0.1% DMSO) for 48 h. After 48 h, cells of the indicated treatment were incubated with the Magic Red solution for 30 min and visualized by confocal microscopy e or monitored by a fluorescence microplate reader as described in the “Methods” section f . The results were analyzed by two-way ANOVA, followed by Tukey’s post hoc test. Data are presented as the means ± SEM. *Specific comparison between WT and R6/2 cells infected with the same lentivirus or treatment; #Specific comparison between the sh GFP -infected and sh Lgals3 -infected groups or DMSO-treated and TD139-treated groups of the same genotype; * P < 0.05, ** P < 0.01, *** P < 0.001, **** P < 0.0001. Same P -value denotation for #. Scale bar: 10 µm. Source data is available as a Source Data File

Article Snippet: Primary antibodies included a marker of microglia, IbaI (1:500 for mouse and human brain sections, 1:1000 for cell samples, 019-19741, Wako Laboratory Chemicals), an antibody for brain tissue staining of Gal3 (1:300 for brain sections, AF1197, R&D System), antibodies for the cell staining of Gal3 (0.5 μg/ml, mouse anti-Gal3 B2C10; 1.0 μg/ml goat anti-Gal3 , ), and antibodies for NFκB-p65 (1:100 for tissue sections, 1:200 for cell samples, MAB3026, Millipore), LAMP1 and LAMP2 (1:500, ab24170 and 1:200, ab25339, Abcam), LC3 (1:2000, GTX127375 GeneTex), SDHB (1:500, GTX113833 GeneTex), EM48 (1:500, MAB5374, Millipore), NeuN (1:1000, ABN78 and 1:1000, MAB377, Millipore), S100 (1:1000, Z0311, Dako), CD68 (1:100, ab31630, Abcam), NLRP3 (1:200, AG-20B-0014, AdipoGen), and DARPP32 (1:50, #2302, Cell Signaling).

Techniques: Knockdown, Staining, Marker, Infection, Expressing, shRNA, Control, Immunofluorescence, Incubation, Confocal Microscopy, Fluorescence, Comparison

Knockdown of Gal3 in the brains of R6/2 mice reduces the activation of microglia. Mice of 6 weeks were intrastriatally injected with lentiviruses carrying the indicated shRNA and monitored for an additional 7 weeks. Brain tissues were carefully harvested and subjected to immunofluorescence assays using the indicated antibodies. Nuclei were stained with Hoechst (blue). a The expression levels of Gal3 (green), IbaI (red, a microglia marker), and CD68 (gray, a marker for activated microglia) in the striatum of the indicated mice were determined using immunofluorescence staining. b The expression levels of Gal3 (green), IbaI (red), and p65 (gray) in the striatum of the indicated mice were determined using immunofluorescence staining. The color bars labeled p65 intensity represent the level of p65 intensity, from low to high fluorescence signals (blue → red, respectively). Twelve image frames of each animal were analyzed (4 animals in each group). c Striatal homogenates were analyzed to determine the levels of IL1β and IL10 by ELISA. Each dot represents the mean value of each mouse (3–6 animals in each group). Data are presented as the means ± SEM. The results were analyzed by two-way ANOVA followed by Tukey’s post hoc test. *Specific comparison between WT and R6/2 mice infected with the same lentivirus; #Specific comparison between mice of the same genotype. * P < 0.05, ** P < 0.01, *** P < 0.001, **** P < 0.0001. Same P -value denotation for #. Scale bar: 10 µm. Source data is available as a Source Data File

Journal: Nature Communications

Article Title: Galectin-3 is required for the microglia-mediated brain inflammation in a model of Huntington’s disease

doi: 10.1038/s41467-019-11441-0

Figure Lengend Snippet: Knockdown of Gal3 in the brains of R6/2 mice reduces the activation of microglia. Mice of 6 weeks were intrastriatally injected with lentiviruses carrying the indicated shRNA and monitored for an additional 7 weeks. Brain tissues were carefully harvested and subjected to immunofluorescence assays using the indicated antibodies. Nuclei were stained with Hoechst (blue). a The expression levels of Gal3 (green), IbaI (red, a microglia marker), and CD68 (gray, a marker for activated microglia) in the striatum of the indicated mice were determined using immunofluorescence staining. b The expression levels of Gal3 (green), IbaI (red), and p65 (gray) in the striatum of the indicated mice were determined using immunofluorescence staining. The color bars labeled p65 intensity represent the level of p65 intensity, from low to high fluorescence signals (blue → red, respectively). Twelve image frames of each animal were analyzed (4 animals in each group). c Striatal homogenates were analyzed to determine the levels of IL1β and IL10 by ELISA. Each dot represents the mean value of each mouse (3–6 animals in each group). Data are presented as the means ± SEM. The results were analyzed by two-way ANOVA followed by Tukey’s post hoc test. *Specific comparison between WT and R6/2 mice infected with the same lentivirus; #Specific comparison between mice of the same genotype. * P < 0.05, ** P < 0.01, *** P < 0.001, **** P < 0.0001. Same P -value denotation for #. Scale bar: 10 µm. Source data is available as a Source Data File

Article Snippet: Primary antibodies included a marker of microglia, IbaI (1:500 for mouse and human brain sections, 1:1000 for cell samples, 019-19741, Wako Laboratory Chemicals), an antibody for brain tissue staining of Gal3 (1:300 for brain sections, AF1197, R&D System), antibodies for the cell staining of Gal3 (0.5 μg/ml, mouse anti-Gal3 B2C10; 1.0 μg/ml goat anti-Gal3 , ), and antibodies for NFκB-p65 (1:100 for tissue sections, 1:200 for cell samples, MAB3026, Millipore), LAMP1 and LAMP2 (1:500, ab24170 and 1:200, ab25339, Abcam), LC3 (1:2000, GTX127375 GeneTex), SDHB (1:500, GTX113833 GeneTex), EM48 (1:500, MAB5374, Millipore), NeuN (1:1000, ABN78 and 1:1000, MAB377, Millipore), S100 (1:1000, Z0311, Dako), CD68 (1:100, ab31630, Abcam), NLRP3 (1:200, AG-20B-0014, AdipoGen), and DARPP32 (1:50, #2302, Cell Signaling).

Techniques: Knockdown, Activation Assay, Injection, shRNA, Immunofluorescence, Staining, Expressing, Marker, Labeling, Fluorescence, Enzyme-linked Immunosorbent Assay, Comparison, Infection

Gal3 triggers IL1β production via an NLRP3 inflammasome-dependent pathway. a Mice of 6 weeks were intrastriatally injected with lentiviruses harboring sh Lgals3 to down-regulate Gal3 and then monitored for an additional 7 weeks. Brain tissues were carefully removed and subjected to immunofluorescence staining to determine the levels of Gal3 (green) and NLRP3 (gray). Four animals in each group were examined. Data are presented as the means ± SEM. *Specific comparison between WT and R6/2 mice infected with the same lentivirus; #Specific comparison between mice of the same genotype. b Primary microglia were treated with MCC950 (1 µM, an inhibitor of NLRP3) or PBS (0.1%) for 24 h. The levels of IL1β released by these cells were measured by ELISA. Each dot represents the mean value of one sample. Three independent experiments were conducted. Data are presented as the mean ± SEM. The results were analyzed by two-way ANOVA followed by Tukey’s post hoc test. *Specific comparison between WT and R6/2 cells; #Specific comparison between R6/2 cells treated with PBS and MCC950. * P < 0.05, ** P < 0.01, **** P < 0.0001. Same P -value denotation for #. Scale bar: 10 µm. Source data is available as a Source Data File

Journal: Nature Communications

Article Title: Galectin-3 is required for the microglia-mediated brain inflammation in a model of Huntington’s disease

doi: 10.1038/s41467-019-11441-0

Figure Lengend Snippet: Gal3 triggers IL1β production via an NLRP3 inflammasome-dependent pathway. a Mice of 6 weeks were intrastriatally injected with lentiviruses harboring sh Lgals3 to down-regulate Gal3 and then monitored for an additional 7 weeks. Brain tissues were carefully removed and subjected to immunofluorescence staining to determine the levels of Gal3 (green) and NLRP3 (gray). Four animals in each group were examined. Data are presented as the means ± SEM. *Specific comparison between WT and R6/2 mice infected with the same lentivirus; #Specific comparison between mice of the same genotype. b Primary microglia were treated with MCC950 (1 µM, an inhibitor of NLRP3) or PBS (0.1%) for 24 h. The levels of IL1β released by these cells were measured by ELISA. Each dot represents the mean value of one sample. Three independent experiments were conducted. Data are presented as the mean ± SEM. The results were analyzed by two-way ANOVA followed by Tukey’s post hoc test. *Specific comparison between WT and R6/2 cells; #Specific comparison between R6/2 cells treated with PBS and MCC950. * P < 0.05, ** P < 0.01, **** P < 0.0001. Same P -value denotation for #. Scale bar: 10 µm. Source data is available as a Source Data File

Article Snippet: Primary antibodies included a marker of microglia, IbaI (1:500 for mouse and human brain sections, 1:1000 for cell samples, 019-19741, Wako Laboratory Chemicals), an antibody for brain tissue staining of Gal3 (1:300 for brain sections, AF1197, R&D System), antibodies for the cell staining of Gal3 (0.5 μg/ml, mouse anti-Gal3 B2C10; 1.0 μg/ml goat anti-Gal3 , ), and antibodies for NFκB-p65 (1:100 for tissue sections, 1:200 for cell samples, MAB3026, Millipore), LAMP1 and LAMP2 (1:500, ab24170 and 1:200, ab25339, Abcam), LC3 (1:2000, GTX127375 GeneTex), SDHB (1:500, GTX113833 GeneTex), EM48 (1:500, MAB5374, Millipore), NeuN (1:1000, ABN78 and 1:1000, MAB377, Millipore), S100 (1:1000, Z0311, Dako), CD68 (1:100, ab31630, Abcam), NLRP3 (1:200, AG-20B-0014, AdipoGen), and DARPP32 (1:50, #2302, Cell Signaling).

Techniques: Injection, Immunofluorescence, Staining, Comparison, Infection, Enzyme-linked Immunosorbent Assay

Knockdown of Gal3 ameliorates HD symptoms in R6/2 mice. Mice of 6 weeks were intrastriatally injected with the sh Lgals3 -expressing or shGFP -expressing lentivirus, and monitored for an additional 7 weeks ( n = 9–11 mice in each group). a The motor functions of R6/2 mice and their littermate controls were assessed by rotarod performance. b Kaplan–Meier plots of R6/2 and WT mice ( P = 0.0089). c Body weight of the indicated animal was measured from 7 to 13 weeks of age. Brain tissues were carefully removed and subjected to immunofluorescence staining to determine the amount of mHTT aggregates (green, EM48; d , e ) or DARPP32 (green, a marker for the medium spiny neurons (MSNs), g , h ), on the neurons (NeuN, red; a neuronal marker; d , f , g ). Nuclei were stained with Hoechst (blue). Four animals were analyzed in each group. The results were analyzed by two-way ANOVA followed by Tukey’s post hoc test. Data are presented as the means ± SEM. *Specific comparison between WT and R6/2 mice infected with the same lentivirus; #Specific comparison between mice of the same genotype. * P < 0.05, ** P < 0.01, *** P < 0.001, **** P < 0.0001. Same P -value denotation for #. Scale bar: 10 µm. Source data is available as a Source Data File

Journal: Nature Communications

Article Title: Galectin-3 is required for the microglia-mediated brain inflammation in a model of Huntington’s disease

doi: 10.1038/s41467-019-11441-0

Figure Lengend Snippet: Knockdown of Gal3 ameliorates HD symptoms in R6/2 mice. Mice of 6 weeks were intrastriatally injected with the sh Lgals3 -expressing or shGFP -expressing lentivirus, and monitored for an additional 7 weeks ( n = 9–11 mice in each group). a The motor functions of R6/2 mice and their littermate controls were assessed by rotarod performance. b Kaplan–Meier plots of R6/2 and WT mice ( P = 0.0089). c Body weight of the indicated animal was measured from 7 to 13 weeks of age. Brain tissues were carefully removed and subjected to immunofluorescence staining to determine the amount of mHTT aggregates (green, EM48; d , e ) or DARPP32 (green, a marker for the medium spiny neurons (MSNs), g , h ), on the neurons (NeuN, red; a neuronal marker; d , f , g ). Nuclei were stained with Hoechst (blue). Four animals were analyzed in each group. The results were analyzed by two-way ANOVA followed by Tukey’s post hoc test. Data are presented as the means ± SEM. *Specific comparison between WT and R6/2 mice infected with the same lentivirus; #Specific comparison between mice of the same genotype. * P < 0.05, ** P < 0.01, *** P < 0.001, **** P < 0.0001. Same P -value denotation for #. Scale bar: 10 µm. Source data is available as a Source Data File

Article Snippet: Primary antibodies included a marker of microglia, IbaI (1:500 for mouse and human brain sections, 1:1000 for cell samples, 019-19741, Wako Laboratory Chemicals), an antibody for brain tissue staining of Gal3 (1:300 for brain sections, AF1197, R&D System), antibodies for the cell staining of Gal3 (0.5 μg/ml, mouse anti-Gal3 B2C10; 1.0 μg/ml goat anti-Gal3 , ), and antibodies for NFκB-p65 (1:100 for tissue sections, 1:200 for cell samples, MAB3026, Millipore), LAMP1 and LAMP2 (1:500, ab24170 and 1:200, ab25339, Abcam), LC3 (1:2000, GTX127375 GeneTex), SDHB (1:500, GTX113833 GeneTex), EM48 (1:500, MAB5374, Millipore), NeuN (1:1000, ABN78 and 1:1000, MAB377, Millipore), S100 (1:1000, Z0311, Dako), CD68 (1:100, ab31630, Abcam), NLRP3 (1:200, AG-20B-0014, AdipoGen), and DARPP32 (1:50, #2302, Cell Signaling).

Techniques: Knockdown, Injection, Expressing, Immunofluorescence, Staining, Marker, Comparison, Infection

Schematic representation of the detrimental role of Gal3 in HD microglia. Under normal conditions, microglia express low levels of Gal3 and pro-inflammatory cytokines. In Huntington’s disease, the presence of mHTT activates NFκB, which evokes the expression of Gal3, NLRP3, and pro-inflammatory cytokines (such as IL1β). Gal3 further activates NFκB through a positive feedback loop. On the other hand, the presence of mHTT triggers lysosomal damages as demonstrated by aggregation of Gal3 on the ruptured lysosomes. Furthermore, Gal3 inhibits the clearance of damaged lysosomes and promotes the assembly of NLRP3 inflammasomes, which results in the maturation of IL1β and subsequent inflammatory events

Journal: Nature Communications

Article Title: Galectin-3 is required for the microglia-mediated brain inflammation in a model of Huntington’s disease

doi: 10.1038/s41467-019-11441-0

Figure Lengend Snippet: Schematic representation of the detrimental role of Gal3 in HD microglia. Under normal conditions, microglia express low levels of Gal3 and pro-inflammatory cytokines. In Huntington’s disease, the presence of mHTT activates NFκB, which evokes the expression of Gal3, NLRP3, and pro-inflammatory cytokines (such as IL1β). Gal3 further activates NFκB through a positive feedback loop. On the other hand, the presence of mHTT triggers lysosomal damages as demonstrated by aggregation of Gal3 on the ruptured lysosomes. Furthermore, Gal3 inhibits the clearance of damaged lysosomes and promotes the assembly of NLRP3 inflammasomes, which results in the maturation of IL1β and subsequent inflammatory events

Article Snippet: Primary antibodies included a marker of microglia, IbaI (1:500 for mouse and human brain sections, 1:1000 for cell samples, 019-19741, Wako Laboratory Chemicals), an antibody for brain tissue staining of Gal3 (1:300 for brain sections, AF1197, R&D System), antibodies for the cell staining of Gal3 (0.5 μg/ml, mouse anti-Gal3 B2C10; 1.0 μg/ml goat anti-Gal3 , ), and antibodies for NFκB-p65 (1:100 for tissue sections, 1:200 for cell samples, MAB3026, Millipore), LAMP1 and LAMP2 (1:500, ab24170 and 1:200, ab25339, Abcam), LC3 (1:2000, GTX127375 GeneTex), SDHB (1:500, GTX113833 GeneTex), EM48 (1:500, MAB5374, Millipore), NeuN (1:1000, ABN78 and 1:1000, MAB377, Millipore), S100 (1:1000, Z0311, Dako), CD68 (1:100, ab31630, Abcam), NLRP3 (1:200, AG-20B-0014, AdipoGen), and DARPP32 (1:50, #2302, Cell Signaling).

Techniques: Expressing

Surface glycosylation of seminal prostasomes: lectin- and immune-transmission electron microscopy. A: Lectin-TEM using SNA. Inserts show enlarged characteristic pattern of SNA-reactivity to each sample group. B: Lectin-TEM using ConA. Inserts show enlarged characteristic pattern of ConA-reactivity to vesicles in each sample group. In O, staining of some proteinaceous material was also observed (arrowheads). C: Immune-TEM using anti-galectin-3 antibodies. Inserts show enlarged characteristic pattern of anti-gal-3-reactivity to each sample group. Micrographs show most characteristic patterns obtained. Although differences in the reactivity of particular vesicles could be noticed, it does not affect the general reactivity of the sample (as in IEC when taking all vesicles into account). (N = seminal prostasomes from normozoospermic men; O = seminal prostasomes from oligozoospermic men).

Journal: Upsala Journal of Medical Sciences

Article Title: Surface glycans contribute to differences between seminal prostasomes from normozoospermic and oligozoospermic men

doi: 10.1080/03009734.2019.1592266

Figure Lengend Snippet: Surface glycosylation of seminal prostasomes: lectin- and immune-transmission electron microscopy. A: Lectin-TEM using SNA. Inserts show enlarged characteristic pattern of SNA-reactivity to each sample group. B: Lectin-TEM using ConA. Inserts show enlarged characteristic pattern of ConA-reactivity to vesicles in each sample group. In O, staining of some proteinaceous material was also observed (arrowheads). C: Immune-TEM using anti-galectin-3 antibodies. Inserts show enlarged characteristic pattern of anti-gal-3-reactivity to each sample group. Micrographs show most characteristic patterns obtained. Although differences in the reactivity of particular vesicles could be noticed, it does not affect the general reactivity of the sample (as in IEC when taking all vesicles into account). (N = seminal prostasomes from normozoospermic men; O = seminal prostasomes from oligozoospermic men).

Article Snippet: Monoclonal anti-CD63 antibody (clone TS63) was from Abcam (Cambridge, UK) and biotinylated goat anti-galectin-3 (gal-3) antibodies from R&D Systems (Minneapolis, MN, USA); 3,3′,5,5′-tetramethylbenzidine (TMB), bovine serum albumin (BSA), D-lactose, and methyl- alpha D-mannopyranoside were from Sigma (St. Louis, MO, USA).

Techniques: Transmission Assay, Electron Microscopy, Staining

( A ) UMAP plot showing integrated clustering of immune cells samples from four mouse models of retinal degeneration, including LD model (sorted by Cx3cr1 + ), NaIO 3 model (CD45 + ), P23H model (CD45 + ) and aging model (CD45 + ) and naïve mice (CD45 + ). A total of 15,623 macrophages, including 13,489 microglia, were integrated among four models. PMN, polymorphonuclear neutrophils; mo-MFs, monocyte-derived macrophages; pv-MFs: perivascular macrophages; NK, natural killer. ( B ) UMAP plots showing integrated macrophage clusters by two datasets. Dash circles indicate subretinal microglia (srMG). ( C ) Percentage of sample distribution by clusters. The arrow indicates the enrichment of srMG cluster from degenerating retinas. ( D ) Heatmap of top 30 conserved marker genes of subretinal microglia shared by each model across clusters. Genes were ranked by fold changes. Arrows indicate srMG cluster. ( E ) In situ validation of Gal3 expression on the apical RPE (top) or in the neuroretina from the inner plexiform layer (bottom). Iba1 (green), phalloidin (red, only in RPE) and Gal3 (magenta). Scale bar: 100μm. ( F ) Percentage of Gal3 + cells relative to Iba1 + cells between RPE and neuroretina tissues across models.

Journal: bioRxiv

Article Title: Microglia at Sites of Atrophy Restrict the Progression of Retinal Degeneration via Galectin-3 and Trem2 Interactions

doi: 10.1101/2023.07.19.549403

Figure Lengend Snippet: ( A ) UMAP plot showing integrated clustering of immune cells samples from four mouse models of retinal degeneration, including LD model (sorted by Cx3cr1 + ), NaIO 3 model (CD45 + ), P23H model (CD45 + ) and aging model (CD45 + ) and naïve mice (CD45 + ). A total of 15,623 macrophages, including 13,489 microglia, were integrated among four models. PMN, polymorphonuclear neutrophils; mo-MFs, monocyte-derived macrophages; pv-MFs: perivascular macrophages; NK, natural killer. ( B ) UMAP plots showing integrated macrophage clusters by two datasets. Dash circles indicate subretinal microglia (srMG). ( C ) Percentage of sample distribution by clusters. The arrow indicates the enrichment of srMG cluster from degenerating retinas. ( D ) Heatmap of top 30 conserved marker genes of subretinal microglia shared by each model across clusters. Genes were ranked by fold changes. Arrows indicate srMG cluster. ( E ) In situ validation of Gal3 expression on the apical RPE (top) or in the neuroretina from the inner plexiform layer (bottom). Iba1 (green), phalloidin (red, only in RPE) and Gal3 (magenta). Scale bar: 100μm. ( F ) Percentage of Gal3 + cells relative to Iba1 + cells between RPE and neuroretina tissues across models.

Article Snippet: Primary antibodies used were as follows: rabbit anti-Iba1 (Wako #019-19741), goat anti-Gal3 (R&D #AF1197), rat anti-Gal3 (Biolegend #125401), sheep anti-Trem2 (R&D #AF1729), mouse anti-rhodopsin (Abcam #ab5417) and rabbit anti-Syk (Abcam #ab40781).

Techniques: Derivative Assay, Marker, In Situ, Expressing

( A ) Iba1 (green) and phalloidin (red) staining in RPE flatmounts from LD-subjected mice as indicated. ( B ) Quantifications of subretinal Iba1 + cells as shown in A. ( C ) Iba1 (green) and phalloidin (red) staining in RPE flatmounts from P23H mice as indicated. ( D ) Quantifications of subretinal Iba1 + cells as shown in C. ( E ) Examples of ERG responses at different flash intensities as indicated. ( F ) Representative retinal cross sections of WT, Lgal3 +/- and Lgal3 -/- in P23H mice. ( G and H ) Quantifications of Gal3 depletion efficiency (G) and frequencies of subretinal Iba1 + cells (H) in Gal3 cKO mice (n=9) compared with genotype control mice (n=9) and tamoxifen control (n=8). Scale bars: 100 μm. Data were collected from 2-3 independent experiments. ***: p<0.001; ns: not significant (one-way ANOVA with Tukey’s post hoc test).

Journal: bioRxiv

Article Title: Microglia at Sites of Atrophy Restrict the Progression of Retinal Degeneration via Galectin-3 and Trem2 Interactions

doi: 10.1101/2023.07.19.549403

Figure Lengend Snippet: ( A ) Iba1 (green) and phalloidin (red) staining in RPE flatmounts from LD-subjected mice as indicated. ( B ) Quantifications of subretinal Iba1 + cells as shown in A. ( C ) Iba1 (green) and phalloidin (red) staining in RPE flatmounts from P23H mice as indicated. ( D ) Quantifications of subretinal Iba1 + cells as shown in C. ( E ) Examples of ERG responses at different flash intensities as indicated. ( F ) Representative retinal cross sections of WT, Lgal3 +/- and Lgal3 -/- in P23H mice. ( G and H ) Quantifications of Gal3 depletion efficiency (G) and frequencies of subretinal Iba1 + cells (H) in Gal3 cKO mice (n=9) compared with genotype control mice (n=9) and tamoxifen control (n=8). Scale bars: 100 μm. Data were collected from 2-3 independent experiments. ***: p<0.001; ns: not significant (one-way ANOVA with Tukey’s post hoc test).

Article Snippet: Primary antibodies used were as follows: rabbit anti-Iba1 (Wako #019-19741), goat anti-Gal3 (R&D #AF1197), rat anti-Gal3 (Biolegend #125401), sheep anti-Trem2 (R&D #AF1729), mouse anti-rhodopsin (Abcam #ab5417) and rabbit anti-Syk (Abcam #ab40781).

Techniques: Staining

( A ) Images of phalloidin staining in WT and Lgal3 -/- RPE tissues in LD. ( B ) Quantifications of dysmorphic RPE cells (n=6, 7 and 3, respectively). ( C ) TUNEL (green) and DAPI (blue) staining in WT and Lgal3 -/- retinal cross sections in LD. ONL and INL, outer and inner nuclear layers. ( D ) Quantifications of TUNEL + photoreceptors in ONL (n=5, 5 and 3, respectively). ( E ) Rhodopsin (red) and Iba1 (green) staining in WT and Lgal3 -/- retinal cross sections in LD. Images from single planes of confocal scans were shown. ( F ) Quantifications of rhodopsin+ subretinal microglia (n=4 per group). ( G ) Images of phalloidin staining in WT and Lgal3 -/- RPE tissues at 2 years of age. ( H ) Quantifications of RPE cell size. Dots represent individual images with n=5 mice per group. ( I ) ERG data showing scotopic a- and b-waves in 2-year-old WT (n=5) and Lgal3 -/- (n=5) mice. ( J ) Scotopic a- and b-waves of ERG data among Lgal3 +/+ (n=12), Lgal3 +/- (n=6) and Lgal3 -/- (n=10) in P23H mice. ( K ) Quantifications of ONL thickness among Lgal3 +/+ (n=7), Lgal3 +/- (n=7), and Lgal3 -/- (n=8) in P23H mice. ( L ) Representative images of dysmorphic RPE cells in Gal3 cKO in LD. Iba1, green; phalloidin, red; Gal3, magenta. ( M ) Quantifications of dysmorphic RPE cells in Gal3 cKO mice (n=9) compared with genotype control ( Cx3cr1 CreER/+ Lgals3 fl/fl mice, n=9) and tamoxifen control ( Cx3cr1 CreER/+ mice treated with tamoxifen, n=8). Scale bars: 100μm. Data were collected from 2-3 independent experiments. *: p<0.05; **: p<0.01; ***: p<0.001. One-way ANOVA with Tukey’s post hoc test (B, D and M); unpaired Student’s t-test (F and H); two-way ANOVA with Tukey’s post hoc test (I, J and K).

Journal: bioRxiv

Article Title: Microglia at Sites of Atrophy Restrict the Progression of Retinal Degeneration via Galectin-3 and Trem2 Interactions

doi: 10.1101/2023.07.19.549403

Figure Lengend Snippet: ( A ) Images of phalloidin staining in WT and Lgal3 -/- RPE tissues in LD. ( B ) Quantifications of dysmorphic RPE cells (n=6, 7 and 3, respectively). ( C ) TUNEL (green) and DAPI (blue) staining in WT and Lgal3 -/- retinal cross sections in LD. ONL and INL, outer and inner nuclear layers. ( D ) Quantifications of TUNEL + photoreceptors in ONL (n=5, 5 and 3, respectively). ( E ) Rhodopsin (red) and Iba1 (green) staining in WT and Lgal3 -/- retinal cross sections in LD. Images from single planes of confocal scans were shown. ( F ) Quantifications of rhodopsin+ subretinal microglia (n=4 per group). ( G ) Images of phalloidin staining in WT and Lgal3 -/- RPE tissues at 2 years of age. ( H ) Quantifications of RPE cell size. Dots represent individual images with n=5 mice per group. ( I ) ERG data showing scotopic a- and b-waves in 2-year-old WT (n=5) and Lgal3 -/- (n=5) mice. ( J ) Scotopic a- and b-waves of ERG data among Lgal3 +/+ (n=12), Lgal3 +/- (n=6) and Lgal3 -/- (n=10) in P23H mice. ( K ) Quantifications of ONL thickness among Lgal3 +/+ (n=7), Lgal3 +/- (n=7), and Lgal3 -/- (n=8) in P23H mice. ( L ) Representative images of dysmorphic RPE cells in Gal3 cKO in LD. Iba1, green; phalloidin, red; Gal3, magenta. ( M ) Quantifications of dysmorphic RPE cells in Gal3 cKO mice (n=9) compared with genotype control ( Cx3cr1 CreER/+ Lgals3 fl/fl mice, n=9) and tamoxifen control ( Cx3cr1 CreER/+ mice treated with tamoxifen, n=8). Scale bars: 100μm. Data were collected from 2-3 independent experiments. *: p<0.05; **: p<0.01; ***: p<0.001. One-way ANOVA with Tukey’s post hoc test (B, D and M); unpaired Student’s t-test (F and H); two-way ANOVA with Tukey’s post hoc test (I, J and K).

Article Snippet: Primary antibodies used were as follows: rabbit anti-Iba1 (Wako #019-19741), goat anti-Gal3 (R&D #AF1197), rat anti-Gal3 (Biolegend #125401), sheep anti-Trem2 (R&D #AF1729), mouse anti-rhodopsin (Abcam #ab5417) and rabbit anti-Syk (Abcam #ab40781).

Techniques: Staining, TUNEL Assay

( A ) Violin plots showing the upregulation of genes ( Lgals3, Syk and Ctnnb1I) related to Trem2 signaling by subretinal microglia from the integrated dataset of all four mouse models. ( B ) Images of Iba1 (green) and Trem2 (red) staining in naïve microglia from inner retina and subretinal microglia in LD. ( C ) Images of Iba1 (green) and Syk (red) staining in subretinal microglia and microglia from inner retina in LD. ( D ) 3D rendering images of Gal3 (green), Trem2 (red) and Iba1 (white) staining in subretinal microglia in LD. Views from both the apical RPE aspect and neuroretina aspect are shown. ( E ) Images of Iba1 (green), Trem2 (red) and Gal3 (magenta) staining in subretinal microglia between control and Trem2 cKO mice in LD. ( F-H ) Quantifications of Trem2 depletion (F, n=4 per group), Iba1 + cells (G, n=9) and Gal3 + cells (H, n=9) between control and Trem2 cKO mice. ( I ) Fundus images showing increased subretinal white lesions in of Trem2 cKO mice in LD as indicated by arrows. Images from four individual mice per group are shown. ( J ) Images of phalloidin staining in RPE tissues from control and Trem2 cKO mice in LD. ( K ) Quantifications of dysmorphic RPE cells between control and Trem2 cKO mice (n=9 per group). Scale bars: 50μm (D); 100μm (B, C E,and J). Data were collected from 2 independent experiments. **: p<0.01; ***: p<0.001. Unpaired Student’s t-test (F-H).

Journal: bioRxiv

Article Title: Microglia at Sites of Atrophy Restrict the Progression of Retinal Degeneration via Galectin-3 and Trem2 Interactions

doi: 10.1101/2023.07.19.549403

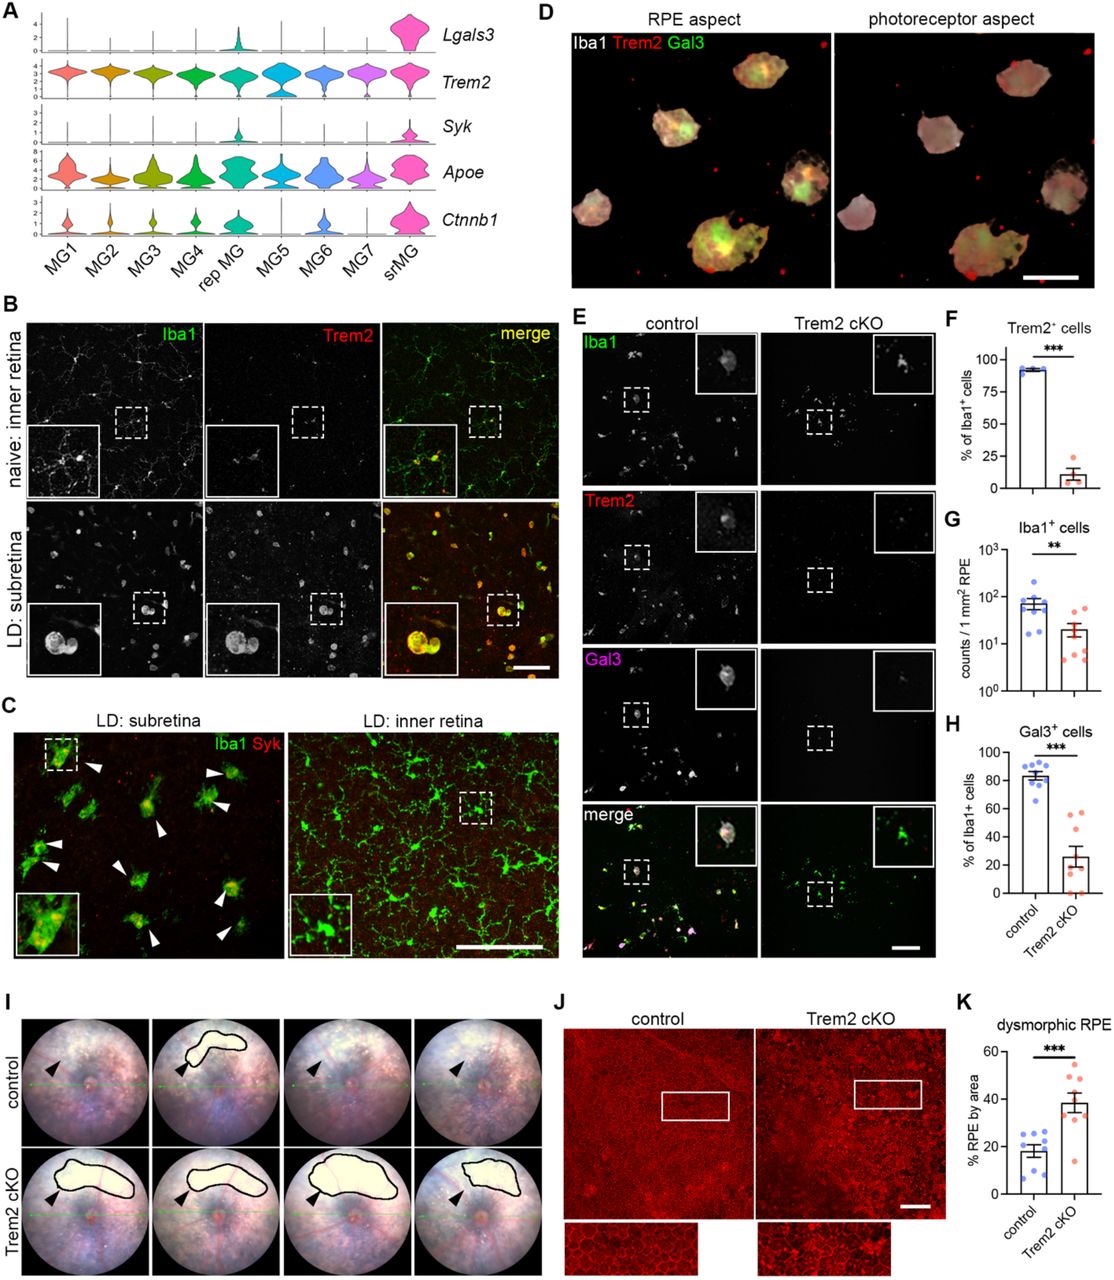
Figure Lengend Snippet: ( A ) Violin plots showing the upregulation of genes ( Lgals3, Syk and Ctnnb1I) related to Trem2 signaling by subretinal microglia from the integrated dataset of all four mouse models. ( B ) Images of Iba1 (green) and Trem2 (red) staining in naïve microglia from inner retina and subretinal microglia in LD. ( C ) Images of Iba1 (green) and Syk (red) staining in subretinal microglia and microglia from inner retina in LD. ( D ) 3D rendering images of Gal3 (green), Trem2 (red) and Iba1 (white) staining in subretinal microglia in LD. Views from both the apical RPE aspect and neuroretina aspect are shown. ( E ) Images of Iba1 (green), Trem2 (red) and Gal3 (magenta) staining in subretinal microglia between control and Trem2 cKO mice in LD. ( F-H ) Quantifications of Trem2 depletion (F, n=4 per group), Iba1 + cells (G, n=9) and Gal3 + cells (H, n=9) between control and Trem2 cKO mice. ( I ) Fundus images showing increased subretinal white lesions in of Trem2 cKO mice in LD as indicated by arrows. Images from four individual mice per group are shown. ( J ) Images of phalloidin staining in RPE tissues from control and Trem2 cKO mice in LD. ( K ) Quantifications of dysmorphic RPE cells between control and Trem2 cKO mice (n=9 per group). Scale bars: 50μm (D); 100μm (B, C E,and J). Data were collected from 2 independent experiments. **: p<0.01; ***: p<0.001. Unpaired Student’s t-test (F-H).

Article Snippet: Primary antibodies used were as follows: rabbit anti-Iba1 (Wako #019-19741), goat anti-Gal3 (R&D #AF1197), rat anti-Gal3 (Biolegend #125401), sheep anti-Trem2 (R&D #AF1729), mouse anti-rhodopsin (Abcam #ab5417) and rabbit anti-Syk (Abcam #ab40781).

Techniques: Staining

( A ) Split views of confocal scans showing the colocalization of Trem2 (red) and Gal3 (green) in the subretinal microglia. Lines indicate the RPE-facing and neuroretina (NR)-facing aspects as indicated. ( B ) Fundus images showing increased subretinal white lesions in anti-Trem2 mAb178 treated mice in LD as indicated by arrows. Images of 4 individual mice per group are shown. ( C ) Images of Iba1 (green) and Gal3 (magenta) staining in subretinal microglia between control and mAb178-treated mice in LD. Scale bar: 100 μm. ( D and E ) Quantifications of Iba1 + cells and Gal3 + cells between control and mAb178 (n=8 per group). ( F ) Images of phalloidin staining in RPE flatmounts from control and mAb178 treated mice in LD. Scale bar: 100μm. ( G ) Quantifications of dysmorphic RPE cells between control (n=8) and mAb178 (n=9) treated mice. ( H ) Images of Iba1 (green) and Trem2 (red) in microglia from the inner retina of naïve control and Trem2 cKO mice. Scale bar: 50μm.

Journal: bioRxiv

Article Title: Microglia at Sites of Atrophy Restrict the Progression of Retinal Degeneration via Galectin-3 and Trem2 Interactions

doi: 10.1101/2023.07.19.549403

Figure Lengend Snippet: ( A ) Split views of confocal scans showing the colocalization of Trem2 (red) and Gal3 (green) in the subretinal microglia. Lines indicate the RPE-facing and neuroretina (NR)-facing aspects as indicated. ( B ) Fundus images showing increased subretinal white lesions in anti-Trem2 mAb178 treated mice in LD as indicated by arrows. Images of 4 individual mice per group are shown. ( C ) Images of Iba1 (green) and Gal3 (magenta) staining in subretinal microglia between control and mAb178-treated mice in LD. Scale bar: 100 μm. ( D and E ) Quantifications of Iba1 + cells and Gal3 + cells between control and mAb178 (n=8 per group). ( F ) Images of phalloidin staining in RPE flatmounts from control and mAb178 treated mice in LD. Scale bar: 100μm. ( G ) Quantifications of dysmorphic RPE cells between control (n=8) and mAb178 (n=9) treated mice. ( H ) Images of Iba1 (green) and Trem2 (red) in microglia from the inner retina of naïve control and Trem2 cKO mice. Scale bar: 50μm.

Article Snippet: Primary antibodies used were as follows: rabbit anti-Iba1 (Wako #019-19741), goat anti-Gal3 (R&D #AF1197), rat anti-Gal3 (Biolegend #125401), sheep anti-Trem2 (R&D #AF1729), mouse anti-rhodopsin (Abcam #ab5417) and rabbit anti-Syk (Abcam #ab40781).

Techniques: Staining

( A ) ELISA of soluble Trem2 (sTrem2) in vitreous fluid and retinal fluid from naïve WT mice, WT and Trem2 cKO mice subjected to LD. ( B ) Fundus images of mice treated with isotype control or 4D9 anti-Trem2 in LD. Four individual mice per group are shown. ( C ) Representative OCT images of mice treated with isotype or 4D9 in LD. ( D ) Quantifications of outer nuclear layer (ONL) thickness by OCT (n=13 per group). ONL thickness was measured at both nasal and temporal sides. ( E and F ) Scotopic a-waves and b-waves of ERG data among mice treated with isotype or 4D9 in naïve or LD setting (n=5 per group). ( G ) Fundus images of Gal3 cKO mice treated with isotype or 4D9 in LD. Four individual mice per group are shown. ( H ) Representative OCT images of Gal3 cKO mice treated with isotype control or 4D9 anti-Trem2 in LD. ( I ) Quantifications of average ONL thickness by OCT between control and Gal3 cKO mice treated with either isotype or 4D9 (n=13 per group). ( J ) Images of phalloidin staining of control and Gal3 cKO RPE treated with isotype or 4D9 in LD. ( K ) Quantifications of dysmorphic RPE cells (n=15, 13, 11 and 13, respectively). Scale bars: 100μm. Data were collected from 2-4 independent experiments. *: p<0.05; **: p<0.01; ***: p<0.001. Unpaired Student’s t-test (F-H). One-way ANOVA with Tukey’s post hoc test (A); two-way ANOVA with Tukey’s post hoc test (D-F, I and K).

Journal: bioRxiv

Article Title: Microglia at Sites of Atrophy Restrict the Progression of Retinal Degeneration via Galectin-3 and Trem2 Interactions

doi: 10.1101/2023.07.19.549403

Figure Lengend Snippet: ( A ) ELISA of soluble Trem2 (sTrem2) in vitreous fluid and retinal fluid from naïve WT mice, WT and Trem2 cKO mice subjected to LD. ( B ) Fundus images of mice treated with isotype control or 4D9 anti-Trem2 in LD. Four individual mice per group are shown. ( C ) Representative OCT images of mice treated with isotype or 4D9 in LD. ( D ) Quantifications of outer nuclear layer (ONL) thickness by OCT (n=13 per group). ONL thickness was measured at both nasal and temporal sides. ( E and F ) Scotopic a-waves and b-waves of ERG data among mice treated with isotype or 4D9 in naïve or LD setting (n=5 per group). ( G ) Fundus images of Gal3 cKO mice treated with isotype or 4D9 in LD. Four individual mice per group are shown. ( H ) Representative OCT images of Gal3 cKO mice treated with isotype control or 4D9 anti-Trem2 in LD. ( I ) Quantifications of average ONL thickness by OCT between control and Gal3 cKO mice treated with either isotype or 4D9 (n=13 per group). ( J ) Images of phalloidin staining of control and Gal3 cKO RPE treated with isotype or 4D9 in LD. ( K ) Quantifications of dysmorphic RPE cells (n=15, 13, 11 and 13, respectively). Scale bars: 100μm. Data were collected from 2-4 independent experiments. *: p<0.05; **: p<0.01; ***: p<0.001. Unpaired Student’s t-test (F-H). One-way ANOVA with Tukey’s post hoc test (A); two-way ANOVA with Tukey’s post hoc test (D-F, I and K).

Article Snippet: Primary antibodies used were as follows: rabbit anti-Iba1 (Wako #019-19741), goat anti-Gal3 (R&D #AF1197), rat anti-Gal3 (Biolegend #125401), sheep anti-Trem2 (R&D #AF1729), mouse anti-rhodopsin (Abcam #ab5417) and rabbit anti-Syk (Abcam #ab40781).

Techniques: Enzyme-linked Immunosorbent Assay, Staining

( A ) Staining of human IgG (red) and Iba1 (green) in retinal cross sections collected from mice with or without 4D9 treatment in LD. The hIgG is used to trace 4D9 antibodies, which outlines retinal vasculatures in 4D9 treated mice. Arrows indicate the presence of 4D9 antibodies in the subretinal microglia, while asters indicate the absence of 4D9 antibodies in microglia from the inner retina. ( B ) Human IgG (red) and Iba1 (green) staining in RPE and neuroretina flatmounts collected from mice treated with 4D9 antibodies in LD. ( C ) Quantifications of hIgG + microglia in the subretinal space and neuroretina. ( D and E ) Quantifications of Iba1 + cells and Gal3 + cells between control and Gal3 cKO mice treated with either isotype or 4D9 (n=13 per group). Scale bars: 100 μm. Data were collected from 2-4 independent experiments. ***: p<0.001; ns: not significant (unpaired Student’s t-test: C; two-way ANOVA with Tukey’s post hoc test: D and E).

Journal: bioRxiv

Article Title: Microglia at Sites of Atrophy Restrict the Progression of Retinal Degeneration via Galectin-3 and Trem2 Interactions

doi: 10.1101/2023.07.19.549403

Figure Lengend Snippet: ( A ) Staining of human IgG (red) and Iba1 (green) in retinal cross sections collected from mice with or without 4D9 treatment in LD. The hIgG is used to trace 4D9 antibodies, which outlines retinal vasculatures in 4D9 treated mice. Arrows indicate the presence of 4D9 antibodies in the subretinal microglia, while asters indicate the absence of 4D9 antibodies in microglia from the inner retina. ( B ) Human IgG (red) and Iba1 (green) staining in RPE and neuroretina flatmounts collected from mice treated with 4D9 antibodies in LD. ( C ) Quantifications of hIgG + microglia in the subretinal space and neuroretina. ( D and E ) Quantifications of Iba1 + cells and Gal3 + cells between control and Gal3 cKO mice treated with either isotype or 4D9 (n=13 per group). Scale bars: 100 μm. Data were collected from 2-4 independent experiments. ***: p<0.001; ns: not significant (unpaired Student’s t-test: C; two-way ANOVA with Tukey’s post hoc test: D and E).

Article Snippet: Primary antibodies used were as follows: rabbit anti-Iba1 (Wako #019-19741), goat anti-Gal3 (R&D #AF1197), rat anti-Gal3 (Biolegend #125401), sheep anti-Trem2 (R&D #AF1729), mouse anti-rhodopsin (Abcam #ab5417) and rabbit anti-Syk (Abcam #ab40781).

Techniques: Staining

( A ) Multispectral imaging of GAL3 and CD68 co-staining in the subretinal space (top) and inner retina (bottom) from human donors. Unmixed purple spectrum (GAL3) and yellow spectrum (CD68) are shown. The areas of colocalized spectra are highlighted in green. Scale bar: 50μm. ONL and INL, outer and inner nuclear layers. ( B ) Representative image of Gal3 and CD68 co-staining in the macular GA region of a retinal section from an 88-year-old female donor eye with advanced AMD (Sarks V). Black insert box shows the magnification of GA with double positive cells. Scale bar: 200μm. ONL and INL, outer and inner nuclear layers; GCL, ganglion cell layer. ( C ) Correlation between the frequencies of macular Gal3 + CD68 + double positive cells (y axis) and Sarks AMD grading (x axis) by Spearman’s correlation (n = 18 donors, Table S2). Coefficient and p-value are shown. ( D ) Histograms showing increased TREM2 + myeloid cells (CD45 + CD11B + ) in RPE/choroid tissues of AMD donors. Concatenated histograms were shown (n=3 per groups). Control human blood samples were used to set up flow gating. ( E-G ) Quantifications of TREM2 + (E), CD45 + (F), and CD11B + (G) cell frequencies in RPE/choroid tissues between non-AMD and AMD donors. Unpaired Student’s t test is used. P-values are shown. ( H ) Correlation between the frequencies of TREM2 + myeloid cells (y axis) and Sarks AMD grading (x axis) in RPE/choroid tissues by Spearman’s correlation. Coefficient and p-value are shown.

Journal: bioRxiv

Article Title: Microglia at Sites of Atrophy Restrict the Progression of Retinal Degeneration via Galectin-3 and Trem2 Interactions

doi: 10.1101/2023.07.19.549403

Figure Lengend Snippet: ( A ) Multispectral imaging of GAL3 and CD68 co-staining in the subretinal space (top) and inner retina (bottom) from human donors. Unmixed purple spectrum (GAL3) and yellow spectrum (CD68) are shown. The areas of colocalized spectra are highlighted in green. Scale bar: 50μm. ONL and INL, outer and inner nuclear layers. ( B ) Representative image of Gal3 and CD68 co-staining in the macular GA region of a retinal section from an 88-year-old female donor eye with advanced AMD (Sarks V). Black insert box shows the magnification of GA with double positive cells. Scale bar: 200μm. ONL and INL, outer and inner nuclear layers; GCL, ganglion cell layer. ( C ) Correlation between the frequencies of macular Gal3 + CD68 + double positive cells (y axis) and Sarks AMD grading (x axis) by Spearman’s correlation (n = 18 donors, Table S2). Coefficient and p-value are shown. ( D ) Histograms showing increased TREM2 + myeloid cells (CD45 + CD11B + ) in RPE/choroid tissues of AMD donors. Concatenated histograms were shown (n=3 per groups). Control human blood samples were used to set up flow gating. ( E-G ) Quantifications of TREM2 + (E), CD45 + (F), and CD11B + (G) cell frequencies in RPE/choroid tissues between non-AMD and AMD donors. Unpaired Student’s t test is used. P-values are shown. ( H ) Correlation between the frequencies of TREM2 + myeloid cells (y axis) and Sarks AMD grading (x axis) in RPE/choroid tissues by Spearman’s correlation. Coefficient and p-value are shown.

Article Snippet: Primary antibodies used were as follows: rabbit anti-Iba1 (Wako #019-19741), goat anti-Gal3 (R&D #AF1197), rat anti-Gal3 (Biolegend #125401), sheep anti-Trem2 (R&D #AF1729), mouse anti-rhodopsin (Abcam #ab5417) and rabbit anti-Syk (Abcam #ab40781).

Techniques: Imaging, Staining

( A ) Images of GAL3 (purple) and CD68 (yellow) co-staining in the macula region of retinal sections from human donors categorized by Sark grades (I-VI). The macular neurosensory retinas of some subject eyes exhibited fixation-related artifactual detachment. In these subjects, separate images of RPE/choroid tissues are shown. Scale bar: 100μm. ONL and INL, outer and inner nuclear layers. GCL, ganglion cell layer. ( B ) Spectral imaging of GAL3 and CD68 co-staining in the geographic atrophy from donor #23 with advanced AMD (Sarks V). Unmixed purple spectrum (GAL3) and yellow spectrum (CD68) are shown. The areas of colocalized spectra are highlighted in green. Scale bar: 50μm. ( C and D ) Images showing the presence of subretinal GAL3 (purple) and CD68 (yellow) double positive cells in the areas with photoreceptor loss and preserved RPE in the transitional area of the macula from an AMD donor (C) and in the age-related peripheral degeneration of a non-AMD donor (D). Scale bars: 100μm. ( E ) Gating strategy of flow cytometry analysis. CD45 + CD11B + cells and CD45 + CD11B - cells from control blood were used to determine the gating of TREM2 + cells. Concatenated plots are shown for non-AMD and AMD. ( F ) Flow contour plots of individual donors showing increased percentage of TREM2 + myeloid cells in AMD.

Journal: bioRxiv

Article Title: Microglia at Sites of Atrophy Restrict the Progression of Retinal Degeneration via Galectin-3 and Trem2 Interactions

doi: 10.1101/2023.07.19.549403

Figure Lengend Snippet: ( A ) Images of GAL3 (purple) and CD68 (yellow) co-staining in the macula region of retinal sections from human donors categorized by Sark grades (I-VI). The macular neurosensory retinas of some subject eyes exhibited fixation-related artifactual detachment. In these subjects, separate images of RPE/choroid tissues are shown. Scale bar: 100μm. ONL and INL, outer and inner nuclear layers. GCL, ganglion cell layer. ( B ) Spectral imaging of GAL3 and CD68 co-staining in the geographic atrophy from donor #23 with advanced AMD (Sarks V). Unmixed purple spectrum (GAL3) and yellow spectrum (CD68) are shown. The areas of colocalized spectra are highlighted in green. Scale bar: 50μm. ( C and D ) Images showing the presence of subretinal GAL3 (purple) and CD68 (yellow) double positive cells in the areas with photoreceptor loss and preserved RPE in the transitional area of the macula from an AMD donor (C) and in the age-related peripheral degeneration of a non-AMD donor (D). Scale bars: 100μm. ( E ) Gating strategy of flow cytometry analysis. CD45 + CD11B + cells and CD45 + CD11B - cells from control blood were used to determine the gating of TREM2 + cells. Concatenated plots are shown for non-AMD and AMD. ( F ) Flow contour plots of individual donors showing increased percentage of TREM2 + myeloid cells in AMD.

Article Snippet: Primary antibodies used were as follows: rabbit anti-Iba1 (Wako #019-19741), goat anti-Gal3 (R&D #AF1197), rat anti-Gal3 (Biolegend #125401), sheep anti-Trem2 (R&D #AF1729), mouse anti-rhodopsin (Abcam #ab5417) and rabbit anti-Syk (Abcam #ab40781).

Techniques: Staining, Imaging, Flow Cytometry